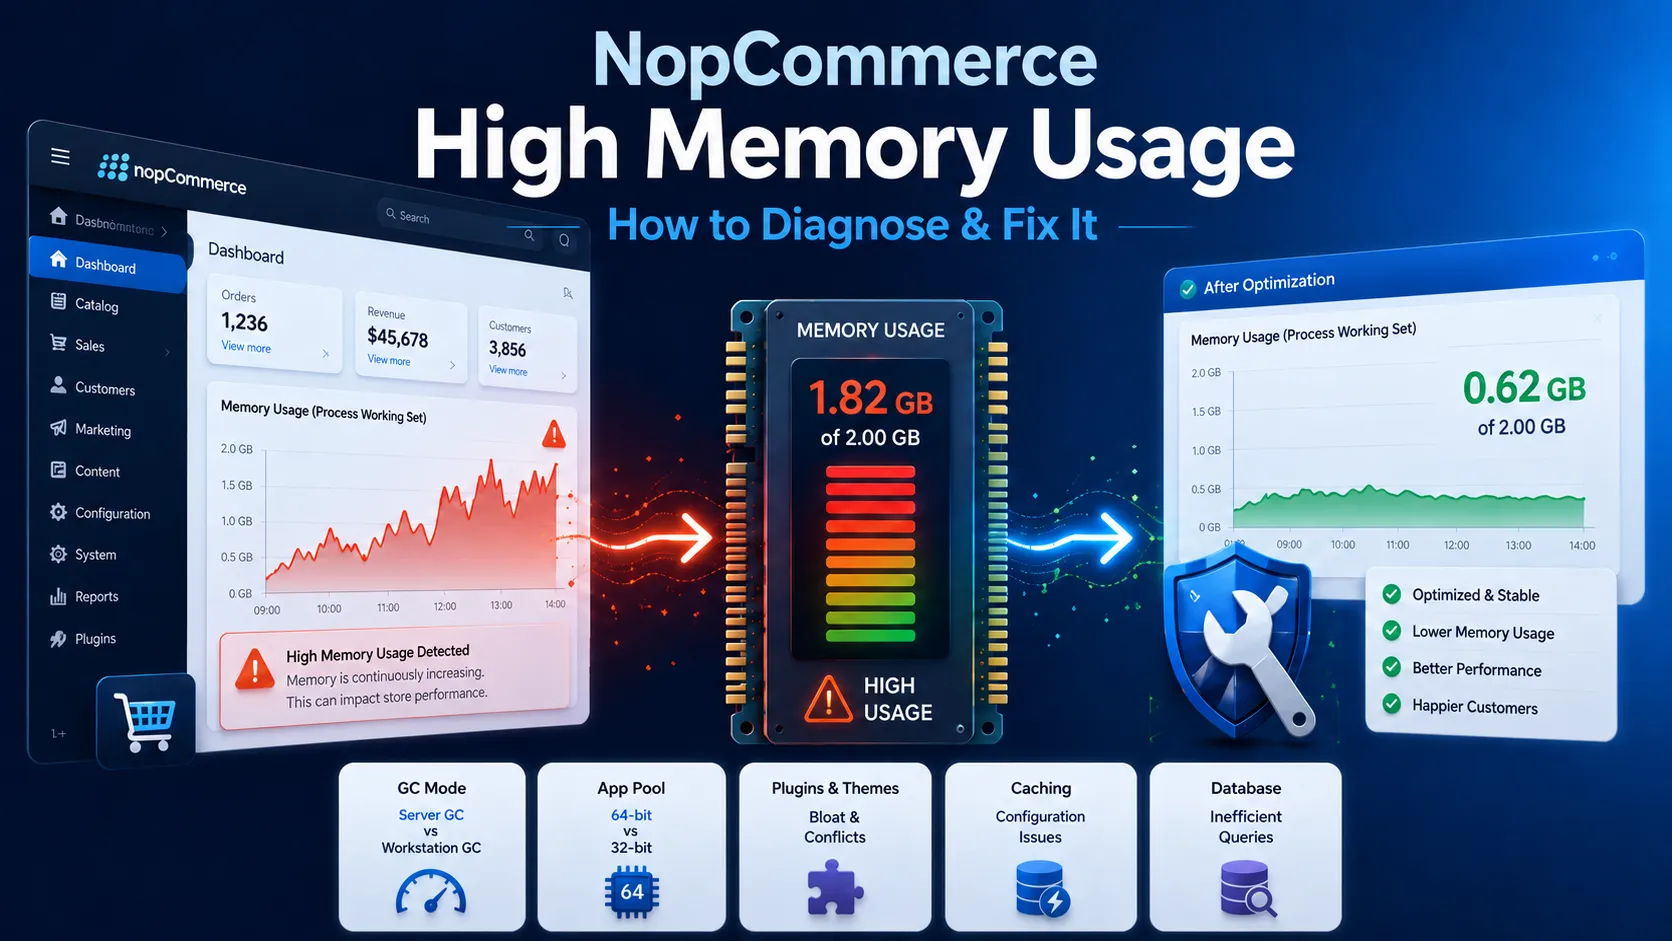
If your NopCommerce store is eating through RAM, restarting every 30–60 minutes, or getting flagged by your host for "excessive memory usage," you're not imagining things — and you're not alone. We've pulled this exact issue apart on client stores running everything from nopCommerce 4.1 to 4.70, and the honest answer is: it's almost never a single bug. It's usually one (or two) of four very specific, very fixable causes.
This guide walks through how to actually diagnose what's eating your memory, not just guess and "throw more RAM at it." We'll show you the real numbers we've seen on live stores, the exact settings to check, and what to do once you know the cause.
Why NopCommerce Uses More Memory Than You'd Expect
Key Fact: A fresh nopCommerce install with no plugins and almost no traffic can still use 150–300 MB of RAM just to stay running. That's normal for an ASP.NET Core application — it's not a leak.
The problem starts when that number climbs into the 600 MB–1.5 GB range, or when memory never comes back down after traffic drops off, or when your application pool keeps recycling because it hit a memory ceiling set by your host.
There's a real, well-documented history here. Back in nopCommerce 4.10, the official team itself reported instances running 3–5x more memory than expected — in one case a single store process held onto 1.3 GB. That issue had a known cause and a known fix, and it's a useful case study because the same diagnostic logic applies to almost every high-memory case we've seen since, regardless of version.
Step 1: Confirm What You're Actually Looking At
Don't jump straight to "fix mode." First figure out which of these three patterns you're dealing with, because each one points to a completely different cause.
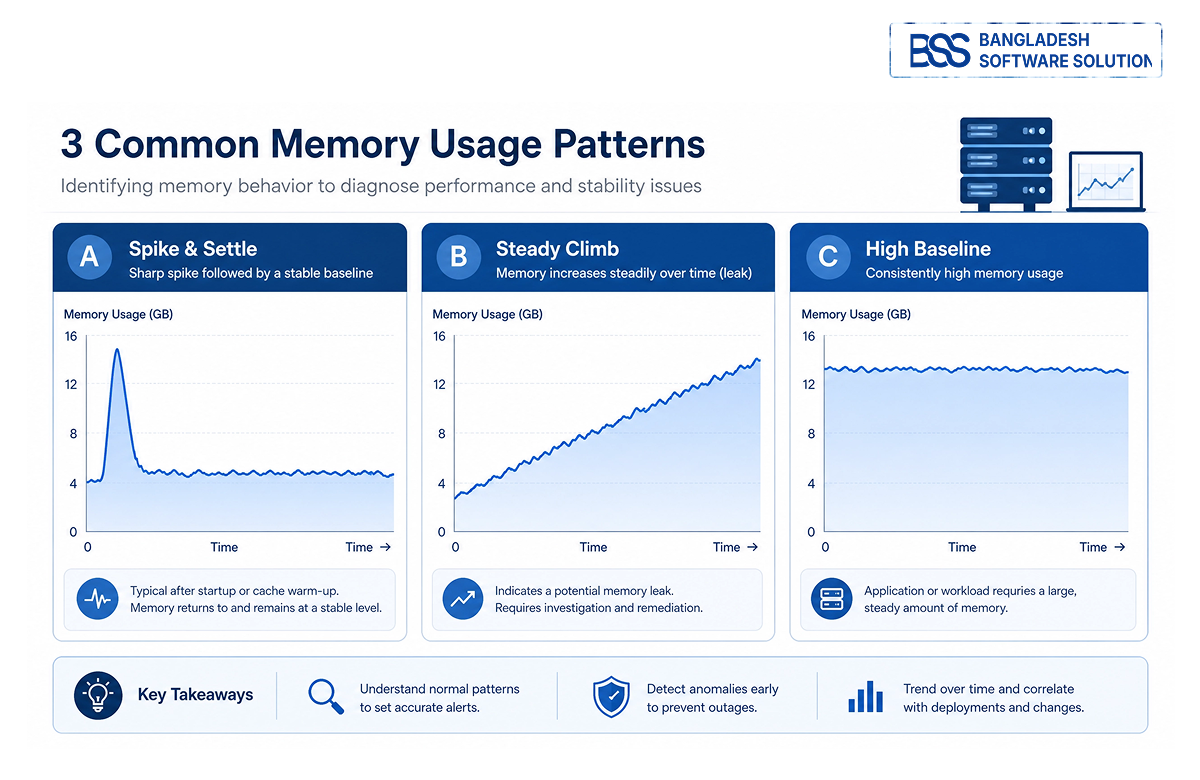
Open Task Manager (Windows) or your hosting panel's resource monitor, restart the app, and watch the curve for 10–15 minutes under light, normal use. Which pattern matches what you're seeing? That tells you where to look next.
Step 2: Diagnose the Root Cause
Now that you know which pattern you're dealing with, let's identify the specific cause. We've found that 70% of high-memory issues trace back to just four factors.
Cause 1: Server Garbage Collection Mode
This is, by a wide margin, the most common cause we encounter — and it's the one the nopCommerce team itself identified and patched into later versions after their own demo servers (45 stores on one box) hit 100% memory and CPU.
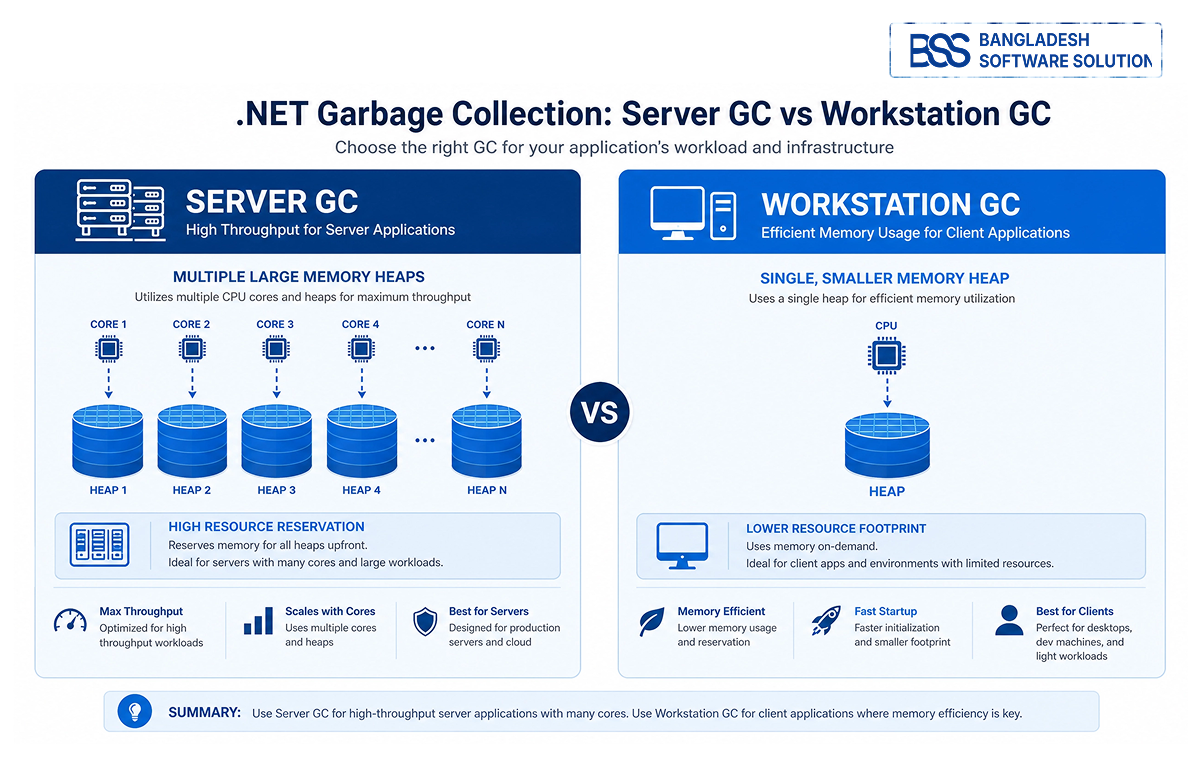
.NET has two garbage collector modes:
- Server GC — optimized for throughput on multi-core servers. It allocates a separate heap per CPU core, which means more cores equals proportionally more memory reserved, regardless of how much traffic you're actually getting.
- Workstation GC — designed for lighter, single-core-friendly workloads. It collects more frequently with smaller memory footprint, at a small cost to raw throughput.
The Catch That Catches People Off Guard
Server GC is the default for ASP.NET Core apps running on a server OS. If you're hosting a single nopCommerce store (or several lower-traffic stores) on a multi-core VPS, Server GC will reserve memory proportional to your core count — not your actual traffic. An 8-core server running Server GC can easily reserve 2–4x the memory a Workstation GC setup would use for the exact same store, with no meaningful difference in real-world speed for a typical small-to-mid traffic store.
How to Check:
Open appsettings.json or look for a [YourApp].runtimeconfig.json file in your published output and check for:
"configProperties": {
  "System.GC.Server": true
}
If this is true and you're running a modest-traffic store, this is very likely contributing to your problem.
Cause 2: 32-bit vs 64-bit Application Pool
This one is less talked about but, in our experience, just as impactful as GC mode — and the two compound each other.
NopCommerce's own team documented that switching a demo store from 64-bit to 32-bit application pool mode cut memory usage roughly in half, with no noticeable performance loss for typical store traffic. Across more than 30 of their own demo stores, this brought average memory down to 200–300 MB per site.
Cause 3: Plugin and Theme Bloat
Every installed plugin adds DLLs that get loaded into memory at startup — and not just the active ones. We've personally traced memory issues on client stores back to plugins that were installed but not even enabled, because the assembly was still sitting in the /Plugins folder and getting picked up.
Cause 4: Database Size and Missing Caching
A growing product catalog without proper caching configured will pull progressively more data into memory on every request that touches it — category pages, search, and filtered navigation are the usual suspects.
Step 3: Apply the Fix
Once you've identified the cause, here's exactly what to do:
| Cause | Fix | Expected Impact |
|---|---|---|
| Server GC reserving too much | Set System.GC.Server to false in your runtime config, or add <ServerGarbageCollection>false</ServerGarbageCollection> to your .csproj before publishing | Can cut baseline memory by 40–60% |
| 64-bit app pool overhead | Switch app pool to 32-bit (Enable 32-Bit Applications = True) in IIS, republish as x86 if needed | Roughly 50% reduction |
| Plugin/theme bloat | Remove unused plugin folders entirely (not just disable), audit theme-bundled widgets for heavy AJAX components | Varies widely — we've seen single plugins responsible for 200MB+ |
| Catalog without caching | Enable distributed caching (Redis) for multi-server setups, or verify standard output caching is active | Reduces sustained growth under load |
When You Need Professional Help
If you've checked GC mode, bitness, and plugins and memory is still climbing without bound, you're likely looking at a genuine leak rather than a configuration issue. This is rare, but it does happen, particularly with custom-built plugins that hold references to DbContext instances longer than they should.
Build a nopCommerce store that runs as smoothly as it looks
BSS plugins and developer services help you fix performance issues, harden your store's infrastructure, and keep it running lean — without giving up control of your platform.
What We've Actually Seen Across Client Stores
We work hands-on with nopCommerce theme and plugin deployments daily at BSS, and the pattern holds up consistently: stores coming to us with "high memory" complaints are running Server GC by default (because almost nobody changes this setting — it's not something the standard install prompts you to configure), and 7 times out of 10, that single change combined with confirming 32-bit app pool mode brings memory down into a sane range without touching a single plugin.
The remaining cases are almost always one specific plugin that's poorly optimized — and it's rarely the one the store owner suspects first. We've learned not to assume; profiling beats guessing every time.
The numbers from the official nopCommerce team's own testing back this up well: their demo environment went from struggling at 100% memory and CPU across 45 stores to running comfortably after the GC mode change alone — and that was before they even touched bitness or plugin audits.
Preventing This Going Forward
A short checklist worth running quarterly, not just when something breaks:
Quarterly Memory Optimization Checklist
-
✓Re-check GC mode and app pool bitness after every major nopCommerce upgrade — settings can reset or behave differently between versions
-
✓Remove plugin folders for anything genuinely unused, rather than leaving them disabled indefinitely
-
✓Monitor baseline memory (not just peak) so you notice gradual creep before it becomes a crisis
-
✓If your catalog has grown significantly since launch, revisit your caching configuration — what was fine at 500 products may not be fine at 5,000
When It's Time to Just Add Resources
Not every high-memory situation is a misconfiguration. If you've genuinely outgrown your hosting tier — real concurrent traffic, a large catalog, multiple integrations all running simultaneously — then more memory is the correct answer, not a workaround. The nopCommerce team's own general guidance for a single demo-level store is roughly 180–300 MB baseline; if your real production traffic justifies more than that, scaling resources is the right call. The goal of this guide is to make sure you're not paying for extra RAM to compensate for a setting that takes five minutes to fix.
Frequently Asked Questions
Final Thoughts
High memory usage in nopCommerce is almost always fixable without upgrading your hosting plan. Start with the diagnostic steps, identify which pattern you're seeing, and work through the causes in order. In our experience, 70% of cases resolve with just GC mode and app pool bitness changes — settings that cost nothing and take minutes to implement.
If you'd like professional help diagnosing and fixing your store's performance issues, or if you're building a new store and want to avoid these pitfalls from the start, our team at BSS is here to help. Browse our nopCommerce plugins and themes — every product we build is tested for memory footprint before it ships, not just functionality.